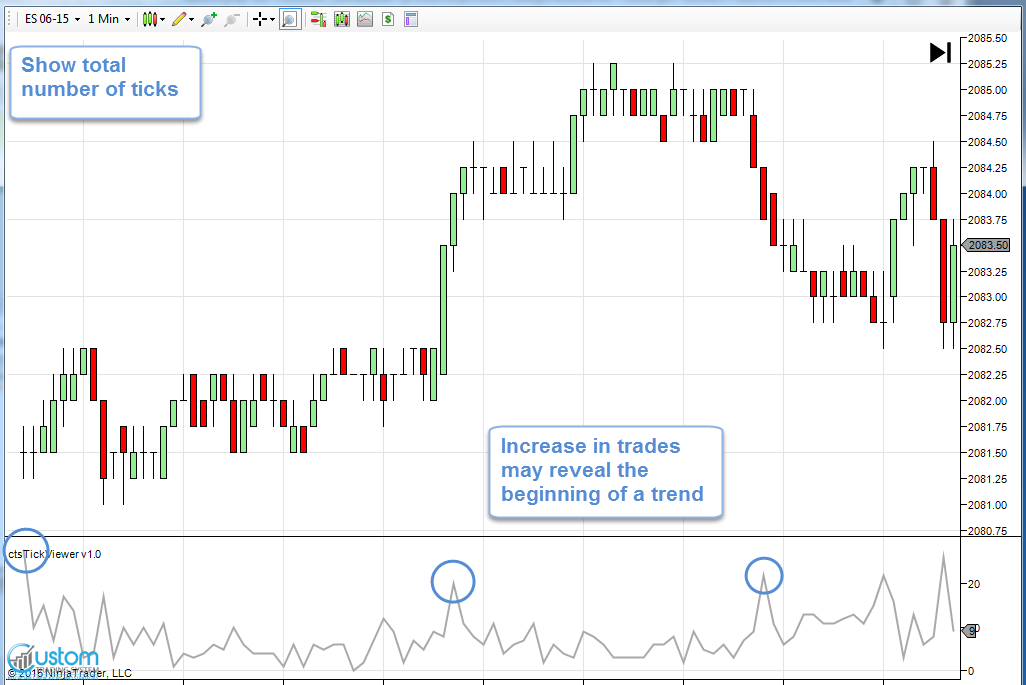
Tick Viewer indicator helps you to spot and confirm market movements with no lag. For example, once a trend begins, there may be a significant increase in number of trades. Or the number of up ticks becomes larger than number of down ticks. Tick Viewer will immediately highlight those inconsistencies.
Tick Viewer draws on chart various tick graphs: number of up ticks, down ticks, total ticks, the difference between up and down ticks. Of course, you can turn on/off each one of them individually as well as configure colors and drawing styles.
You may ask a question: what if AAPL price goes up by 0.03 cents? Would we consider it as 3 up tick or just one up tick? Fortunately, Tick Viewer indicator allows both methods, all you need to do is just to set Weighted Ticks parameter to True or False respectfully.
Finally, Tick Viewer works on historical market data. This means you will never lose your collected data if you decide to change some parameters, add another indicator or update the chart. Please note that you must have realtime and historical tick data for this indicator to work.
Features summary
- Trend or reversal confirmation. Immediately spot an increase in market activity, detect following extremes in price.
- Works on historical data. No more data disappearing after parameters or chart update.
- Fully configurable. Set plot styles and colors that are best for you.
How to use
Watch the total number of ticks in the market. Once you see a significant increase that means market has become active. This may mean a beginning of a trend, reversal or an extreme in price .
Look at the difference between up ticks and down ticks. Normally you don't see a disbalance but once you spot it then it may mean market goes upwards or downwards.
Weighted ticks parameter puts an emphasize on significance of up/down ticks. The bigger the price jumps the more pronounced the difference between the number of up and down ticks will be.